Which Model Should Answer Your Survey?
Choosing a synthetic respondent by its values, not by its accuracy score.
In my last post I argued that we can get around the drawbacks of the homunculus fallacy in digital twin research. The homunculus fallacy is the idea that an AI roleplaying as a person will hand you accurate insights about that person, as if there were a little person living inside the model holding those views. There isn’t. The way around it is to stop treating the model as a person in a box and start treating it as a system reasoning over the information you give it, making reasonable inferences about what that information implies.
The example I used was trivial. Say you know a person values organic food and owns a dog. They are more likely to buy organic dog food than someone who does not value organic food or does not own a dog. A model should be able to deduce a reasonable answer to “would you buy organic dog food?” from those two facts. I then walked through an online demo showing empirically that reasoning, and not roleplay, is the likely mechanism behind synthetic responses.
But it left a central problem dangling. Reasonable inferences often hinge on the model having a useful world model and values that line up with the digital twin population you care about.
So in this post I want to do three things:
Clarify why the choice of model matters.
Show why this is not something we can solve with accuracy metrics.
Give a worked example of how to evaluate the choice of model in a digital twin program.
Why Model Choice Matters
In the last post I gave two examples of a model reasoning over a digital twin. The first, the one I recapped above, feels intuitive. It connects an organic food preference and dog ownership to an intention to buy organic dog food. That reads like something you can deduce straight from the evidence.
The second was less intuitive. We predicted that an organic food preference would be associated with an intention to shop at a farmers market.
That prediction might be reasonable in a North American context. Organic food and farmers markets are both associated with ideas about health, sustainability, local production, and a particular style of consumption. But none of that information was stated in the prompt. For an organic preference to affect the farmers-market answer, the model has to supply the connection itself. It has to carry a prior belief about how those concepts relate.
This is what I mean by an implicit value. It is not necessarily a moral commitment that the model would endorse if you asked it. It is an interpretation embedded in the model’s reasoning: a belief that one characteristic makes another attitude or behaviour more or less likely.
Once you see the assumption in the farmers-market example, go back to the supposedly easy example. Even asserting that a person’s organic food preference will generalize to what they feed their pet assumes something about consistency across product categories. A person might buy organic food for themselves but view organic pet food as marketing. They might care about pesticide exposure in human food but not animal feed. They might simply find organic pet food too expensive.
The first deduction was not assumption-free. Its assumptions were just less visible to us.
The ideal situation would be to lean on these assumptions as little as possible and instead supply all the relevant antecedent information for the model to reason through. This is why I find digital twin offerings from companies like Arima interesting: deep data assets driving the twin profiles give the model a much richer foundation to reason over.
But the problem will never be fully solved. There is no version of a model reasoning over evidence in a digital twin context that does not rest, to some degree, on the model’s own implicit interpretations of the market.
Those interpretations are culturally relative. They can vary across countries and markets because infrastructure, politics, history, and social norms vary.
We should also take seriously the possibility that models disproportionately reflect the interpretations of the people and institutions that create them. Model developers are not a random sample of any consumer market. They are disproportionately affluent technology workers, working inside a small number of organizations and geographies. Training data are much broader than that, but choices about data, evaluation, reinforcement, and acceptable outputs still pass through those institutions.
I am not claiming that every model simply inherits the politics or consumption habits of its developers. I am saying we have no reason to assume that its implicit associations are culturally neutral.
Different models can therefore draw different reasonable implications from the same digital twin profile. That makes the model part of the research design, not interchangeable plumbing.
Why Accuracy Is the Wrong Approach
Digital twin vendors have generally handled this by fine tuning their models on proprietary data and then reporting some kind of validation against an external test case. The claim is that because the model made good out-of-sample predictions in one or more cases, you should feel confident in its predictions going forward.
There are plenty of problems with this, from model drift, to the choice of accuracy measure, to the general opacity of the fine-tuning process. But I want to focus on the one I think is fatal.
There is no single thing to be accurate about.
If accuracy depends in part on the model holding useful implicit values for the population, then you have to ask: accurate to what?
Consumer markets are not a cultural monolith. They are heterogeneous, shifting by place, demographic, politics, category, and time. They are broad, covering an almost uncountable set of associations. They are fluid, changing often and sometimes quickly. And they tend to defy neat categorization.
Suppose a synthetic research system accurately reproduces the results of a grocery survey conducted in urban Canada. That is real evidence in its favour. It tells us the system worked for those questions, with that profile data, for that population, at that time.
It does not tell us whether it will work for an automotive study in rural Texas. More subtly, it may not tell us whether it will work for a different Canadian grocery study aimed at recent immigrants, low-income households, retirees, or affluent technology workers. The boundary of the validated distribution is not printed on the accuracy score.
This is the usual problem of generalizing outside a distribution, with an added complication: we often do not know where the relevant distribution begins and ends. Is it defined by geography? Product category? Demographic? Political culture? The type of evidence stored in the twin? The associations required by the survey question? Usually it is some combination, and a validation test does not isolate the boundary for us.
This is why the model’s dual role in a digital twin experiment matters. A successful validation test tells you two things at once:
The model had useful information to reason over.
The model interpreted that information in a way that fit the validation population.
If the test had failed, you would not know which half was to blame. If it succeeds, you still do not know which half will generalize.
Does the underlying data support your new use case? Will the model’s implicit values generalize to your target market? Does the new question require the same kinds of interpretation as the validation questions? An impressive accuracy score will not answer those questions.
It is helpful to know that a model has worked before. A case of accurate results is evidence. It is just not sufficient evidence.
That means the goal cannot be to certify a model as generically correct. The more defensible goal is a reasonable interpretation of the evidence in a specific research context. And a reasonable interpretation is one made by a model whose relevant implicit values are known to resemble those of the target market.
That gives us something more useful to evaluate.
How to Evaluate Model Choice
If we cannot lean on accuracy metrics alone, what can we use?
My answer is to stop treating evaluation as a binary yes or no. Markets are heterogeneous, and that implies a range of suitability rather than a pass or fail. You do not really want to ask “is this model accurate?” You want to ask “how close are this model’s interpretations to the market I’m trying to learn about?”
Picture a map where markets with different values sit near or far from each other by similarity, with models plotted on top according to the associations they express. You want a model that sits close to your target market on the dimensions relevant to the survey, so you can trust that it is reasoning in roughly the right way about the data you supply.
We can start by measuring the association a model draws between two concepts. The basic question is: when I tell the model that a person has characteristic X, how much does that change its estimate that the person will do Y?
There is an important measurement problem here. If we only ask the conditioned question-
A survey respondent drives an electric vehicle. How likely is this person to install solar panels at home?
-A high answer could mean the model sees a strong EV-to-solar relationship. Or it could mean that the model thinks home solar is generally likely.
So I used a paired design. For every association, the model received both a baseline question and a conditioned question:
BASELINE
Consider a survey respondent.
How likely is this person to install solar panels at home?
Answer with an integer from 1 to 7, where 1 means very unlikely
and 7 means very likely.
Respond only as JSON: {”likelihood”: <integer>}.
CONDITIONED
A survey respondent drives an electric vehicle.
How likely is this person to install solar panels at home?
Answer with an integer from 1 to 7, where 1 means very unlikely
and 7 means very likely.
Respond only as JSON: {”likelihood”: <integer>}.
The association effect is simply:
conditioned score − baseline score
An effect of +2 means that adding the characteristic increased the model’s likelihood estimate by two scale points. This isolates the effect of the supplied characteristic from the model’s baseline view of the behaviour.
I submitted that same baseline-and-conditioned pair five times and took the mean effect. The wording stayed exactly the same on every iteration. This is a modest way to reduce the influence of any one stochastic response without turning prompt wording into a second experimental variable.
The actual request payload looked like this:
python
payload = {
“model”: model,
“temperature”: 0.2,
“max_tokens”: 512,
“response_format”: {”type”: “json_object”},
“messages”: [{
“role”: “user”,
“content”: prompt,
}],
}
And the loop explicitly queried both sides of every pair:
python
for model in models:
for association in associations:
effects = []
for iteration in range(5):
baseline = score(
model,
build_prompt(association, “baseline”),
)
conditioned = score(
model,
build_prompt(association, “conditioned”),
)
effects.append(conditioned - baseline)
mean_effect = sum(effects) / len(effects)
I ran the experiment through OpenRouter on July 29, 2026 using five models from different providers:
OpenAI GPT-5.6 Luna Pro
Anthropic Claude Sonnet 4.5
Google Gemini 2.5 Pro
Mistral Medium 3.1
xAI Grok 4.5
With twelve associations, two conditions, and five iterations, the experiment produced 600 unique calls.
What the Models Did
The heatmap below shows each model’s mean paired effect across the five iterations of the fixed prompt.
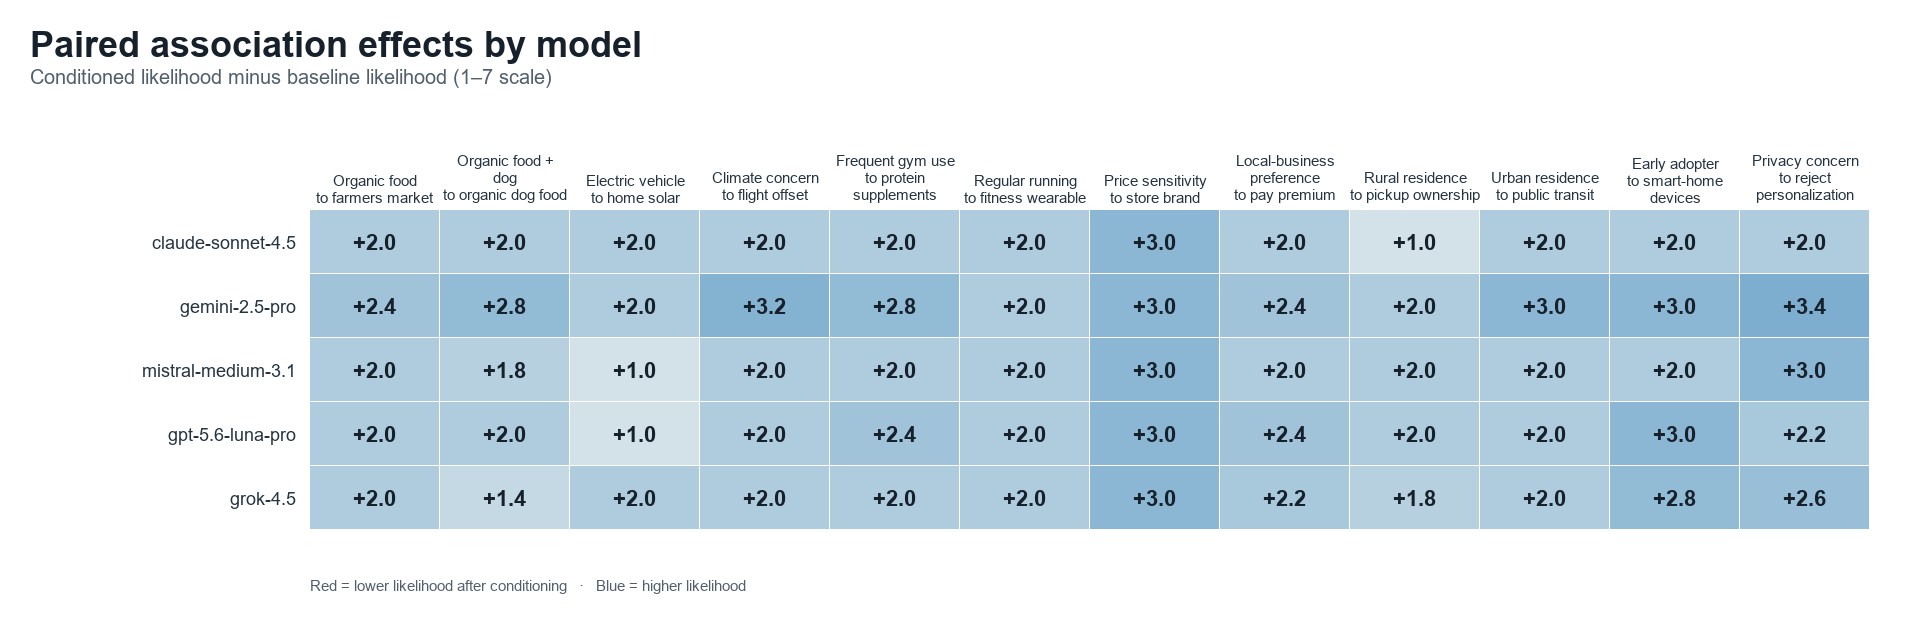
The first result is broad agreement about direction. Every mean effect was positive. Giving the model the hypothesized characteristic always increased its estimate of the related behaviour.
But the models did not agree about magnitude.
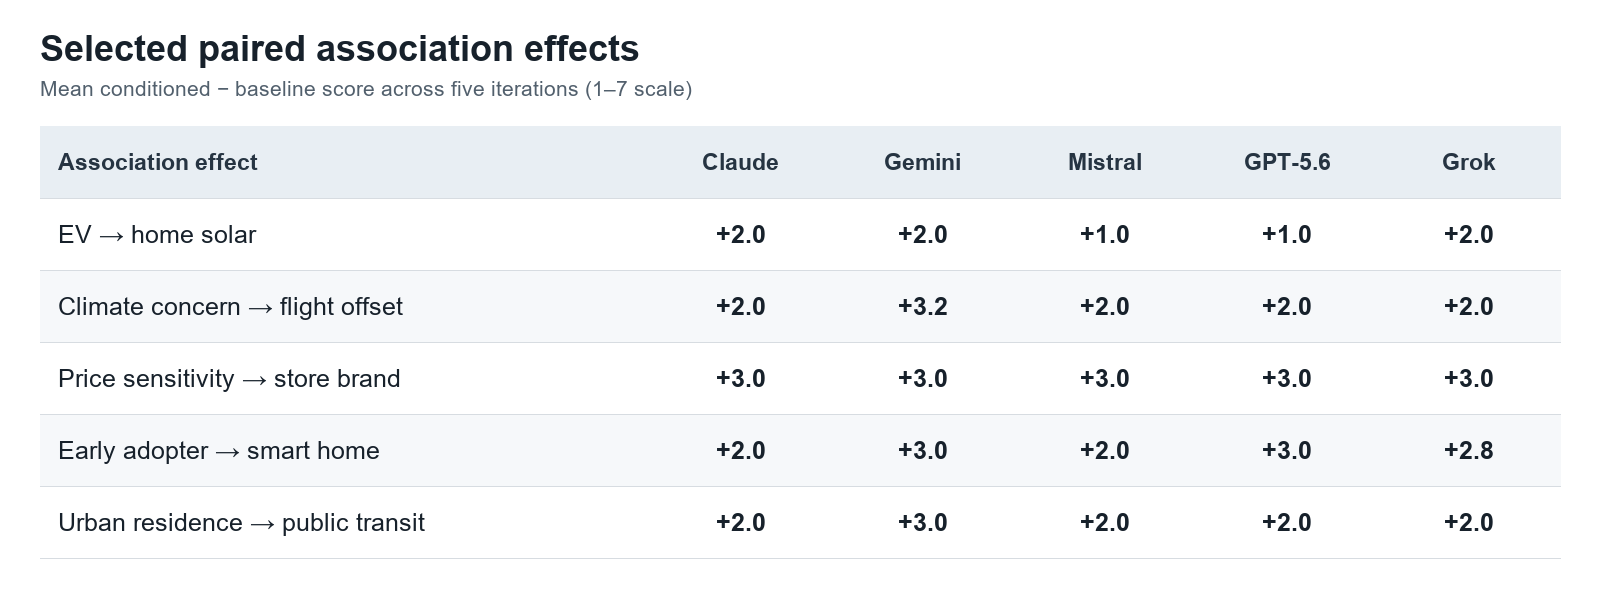
The largest cross-model ranges were 1.4 scale points. They appeared for organic food plus dog ownership to organic dog food, and privacy concern to turning off personalization. Climate concern to flight offsets followed at 1.2 points. At the other extreme, every model gave price sensitivity to store brand a mean effect of exactly +3.0, and every model gave regular running to a fitness wearable +2.0.
The two rhetorical examples from earlier are useful here. Organic preference plus dog ownership increased the organic-dog-food estimate by between +1.4 and +2.8, depending on the model. The organic-to-farmers-market effect was much tighter, from +2.0 to +2.4.
That is not the ordering I would have guessed from intuition alone. The association that made the role of assumptions easiest to explain was not the association on which these models disagreed most.
This is why the exercise has to be empirical. Our own sense that a deduction is “obvious” or culturally contingent is not a reliable guide to where model choice will matter.
Repeating the same prompt also gives us a simple measure of run-to-run variation:
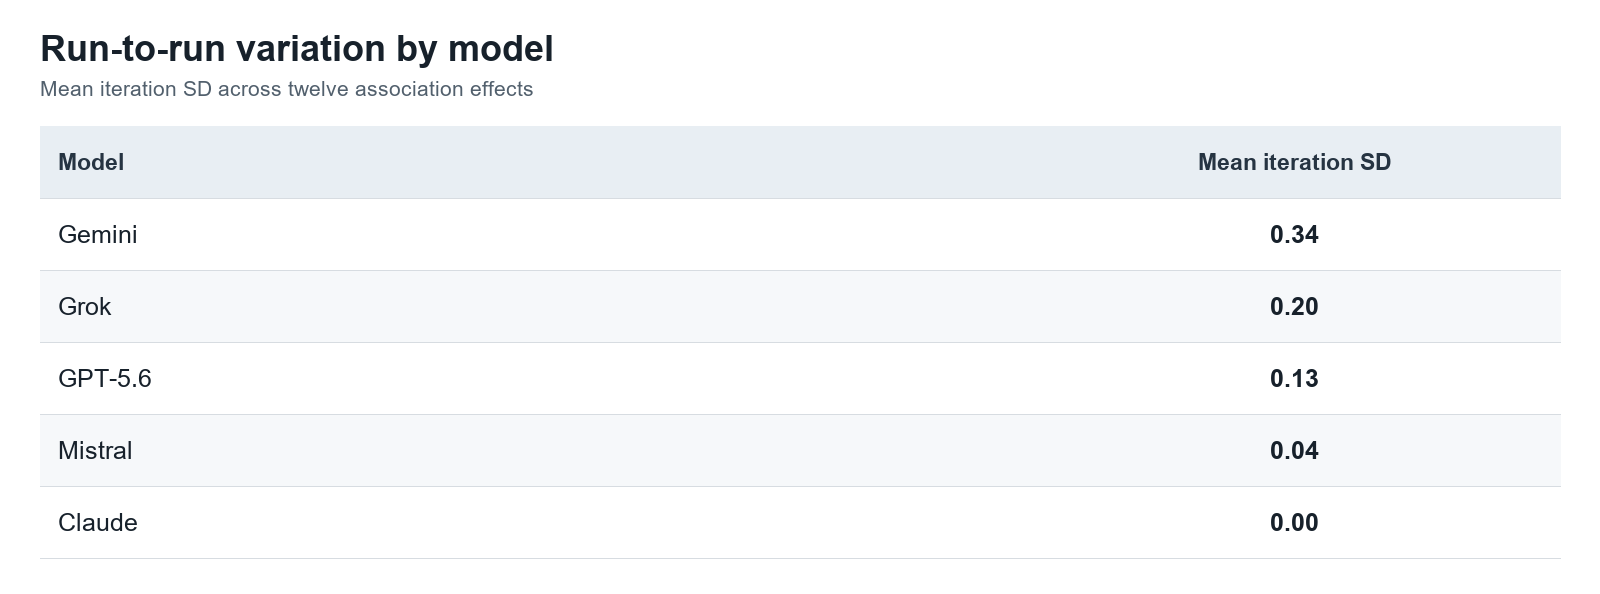
The iteration spread is not a test of prompt robustness; the prompt never changes. It tells us how much the paired effect moved across otherwise identical calls at low temperature. Gemini varied the most, while Claude returned the same paired effect on all five iterations of every association. A model can have a plausible average interpretation but still require more replication if that estimate is unstable.
Mapping the Differences
We can treat each model as a point whose coordinates are its mean association effects and use principal components to project those profiles down to two dimensions. A PCA biplot also lets us place the measured association prompts in the background, showing which relationships contribute to the directions that separate the models.
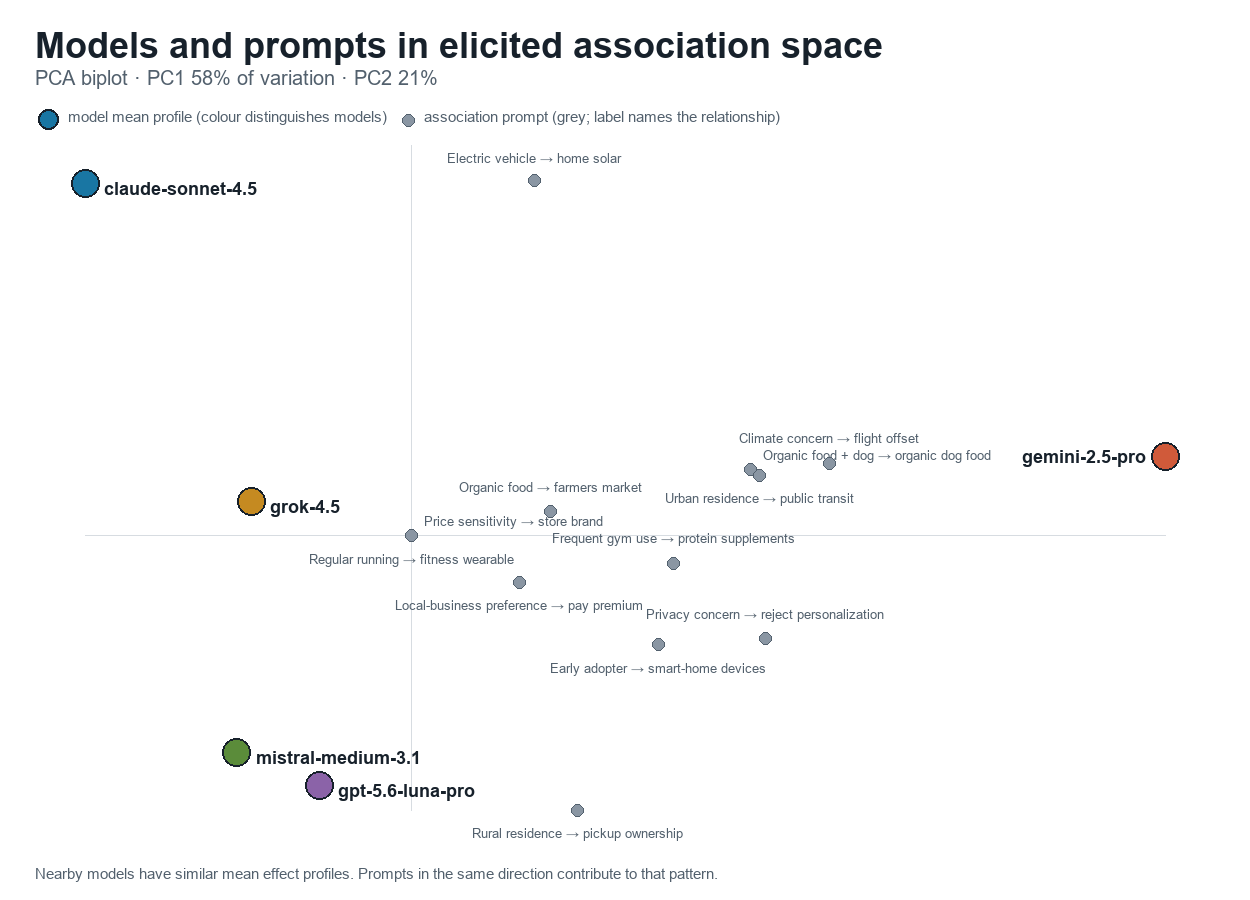
Each large coloured dot is a model’s mean association profile. The smaller grey dots are the specific association prompts, labelled by the relationship they measure.
Not to dwell on this specific visualization, since this is a small sample of questions, but we can already see patterns emerge. The horizontal dimension mainly separates Gemini from the other models because Gemini generally expressed stronger associations across the experiment. The second distinguishes models according to the pattern of those associations, especially the contrast between EV ownership and home solar at one end and rural residence and pickup ownership at the other. Relationships on which every model agreed sit near the centre. Given this, we should reject the idea that these models are interchangeable. They express different association patterns, even if they agree in some areas, they can vary dramatically in others.
Adding the Target Market
To choose among them, the next step is to estimate the same associations in the target market and add that market as another point.
Once that measurement exists, model choice becomes a distance question: which model’s association vector sits closest to the target market on the dimensions known to matter for this survey?
This is where digital twin vendors with robust multi-market databases have a real advantage. They can use those assets not only to build richer twin profiles, but also to estimate market-specific implicit values and test whether the model interpreting those profiles is a reasonable cultural fit. They can show where a model is close, where it is far away, and where none of the available options is convincing.
Some challenges remain. It will be hard, maybe impossible, to map every implicit value feeding a consumer decision, and this is where original research will always outperform synthetic research. But a broad, representative set of associations relevant to the target market can get you a long way.
Also, no model will be perfect. Fine tuning for a specific market might help, though I would be wary of overfitting and of making the model’s measured priors difficult to interpret. Relying less on a thin post-training layer is safer if the aim is to understand the model’s general interpretations of the market.
Conclusions
So what does this mean for digital twin research?
I think the first step is to be clearer about what a synthetic respondent is. It is not a person in a box, and it is not a generic prediction machine that can be certified with a single accuracy score. It is better understood as a data model or simulation: a system that combines evidence about a market with a model’s own interpretation of what that evidence implies.
That means every synthetic response rests on two core inputs. The first is the supporting data: what we know about the people, market, category, and context being simulated. The second is the model’s implicit values: the associations it uses to reason from that evidence to an answer. Richer evidence reduces how much work those priors have to do, but it never removes them completely.
If we want to understand or extract value from the output, we should be asking about both. What information supports this result? How was that information assembled, how current is it, and how well does it represent the target market? Which model interpreted it? What relevant associations does that model express, and how closely do they resemble the interpretations of the people we are trying to learn about?
Those should not be questions that providers answer with a black box and a headline metric. As a research buyer, I would want transparency into the data assets behind the twin, the model and version used to run it, the relevant implicit values that have been tested, and the situations in which the system has and has not been validated. I would also want a hand in choosing the model that runs my synthetic poll. Realistically, why shouldn’t that be on the table?
An accuracy case remains useful. It tells us the system has worked somewhere. But it cannot tell us, by itself, whether our new problem sits inside the same distribution, because we do not know where the relevant boundary lies or which part of the system made the test succeed. “Accurate to what?” has to come before “how accurate?”
The practical standard is therefore not a universally correct synthetic respondent. It is a reasonable and inspectable simulation: one supported by evidence appropriate to the problem, interpreted by a model whose relevant implicit values are known to resemble those of the target market.
This is why I suspect the importance of robust proprietary data assets will only grow with the digital twin market. Those assets are what let companies construct richer twins in the first place. They are also what let providers measure model interpretations against different markets, identify where a model is a good fit, and show where its priors are likely to mislead.
We should spend less time treating accuracy scores as product certifications and more time inspecting the inputs we can actually evaluate: the evidence, the model, and the relationship between them. That requires more transparency from providers and more sophistication from buyers. It may also require more investment than positioning synthetic research as merely a fast, cheap substitute for a survey.
But I think that undersells what these systems can become. When the underlying evidence and model values are visible enough to interrogate, synthetic respondents can be useful simulations rather than mysterious imitations of people. That makes them valuable not only for reproducing a poll, but for testing scenarios, exploring how conclusions change under different assumptions, and simulating markets in ways that were not feasible until now.
First published in The Knowledge Stack.